Experience The UAE's TopProperty BrokerageERP Software
Property Brokerage ERP monitor every asset and obtain property-specific reports.
AI enabled Workspace & Dashboard
R3 AI Workspace
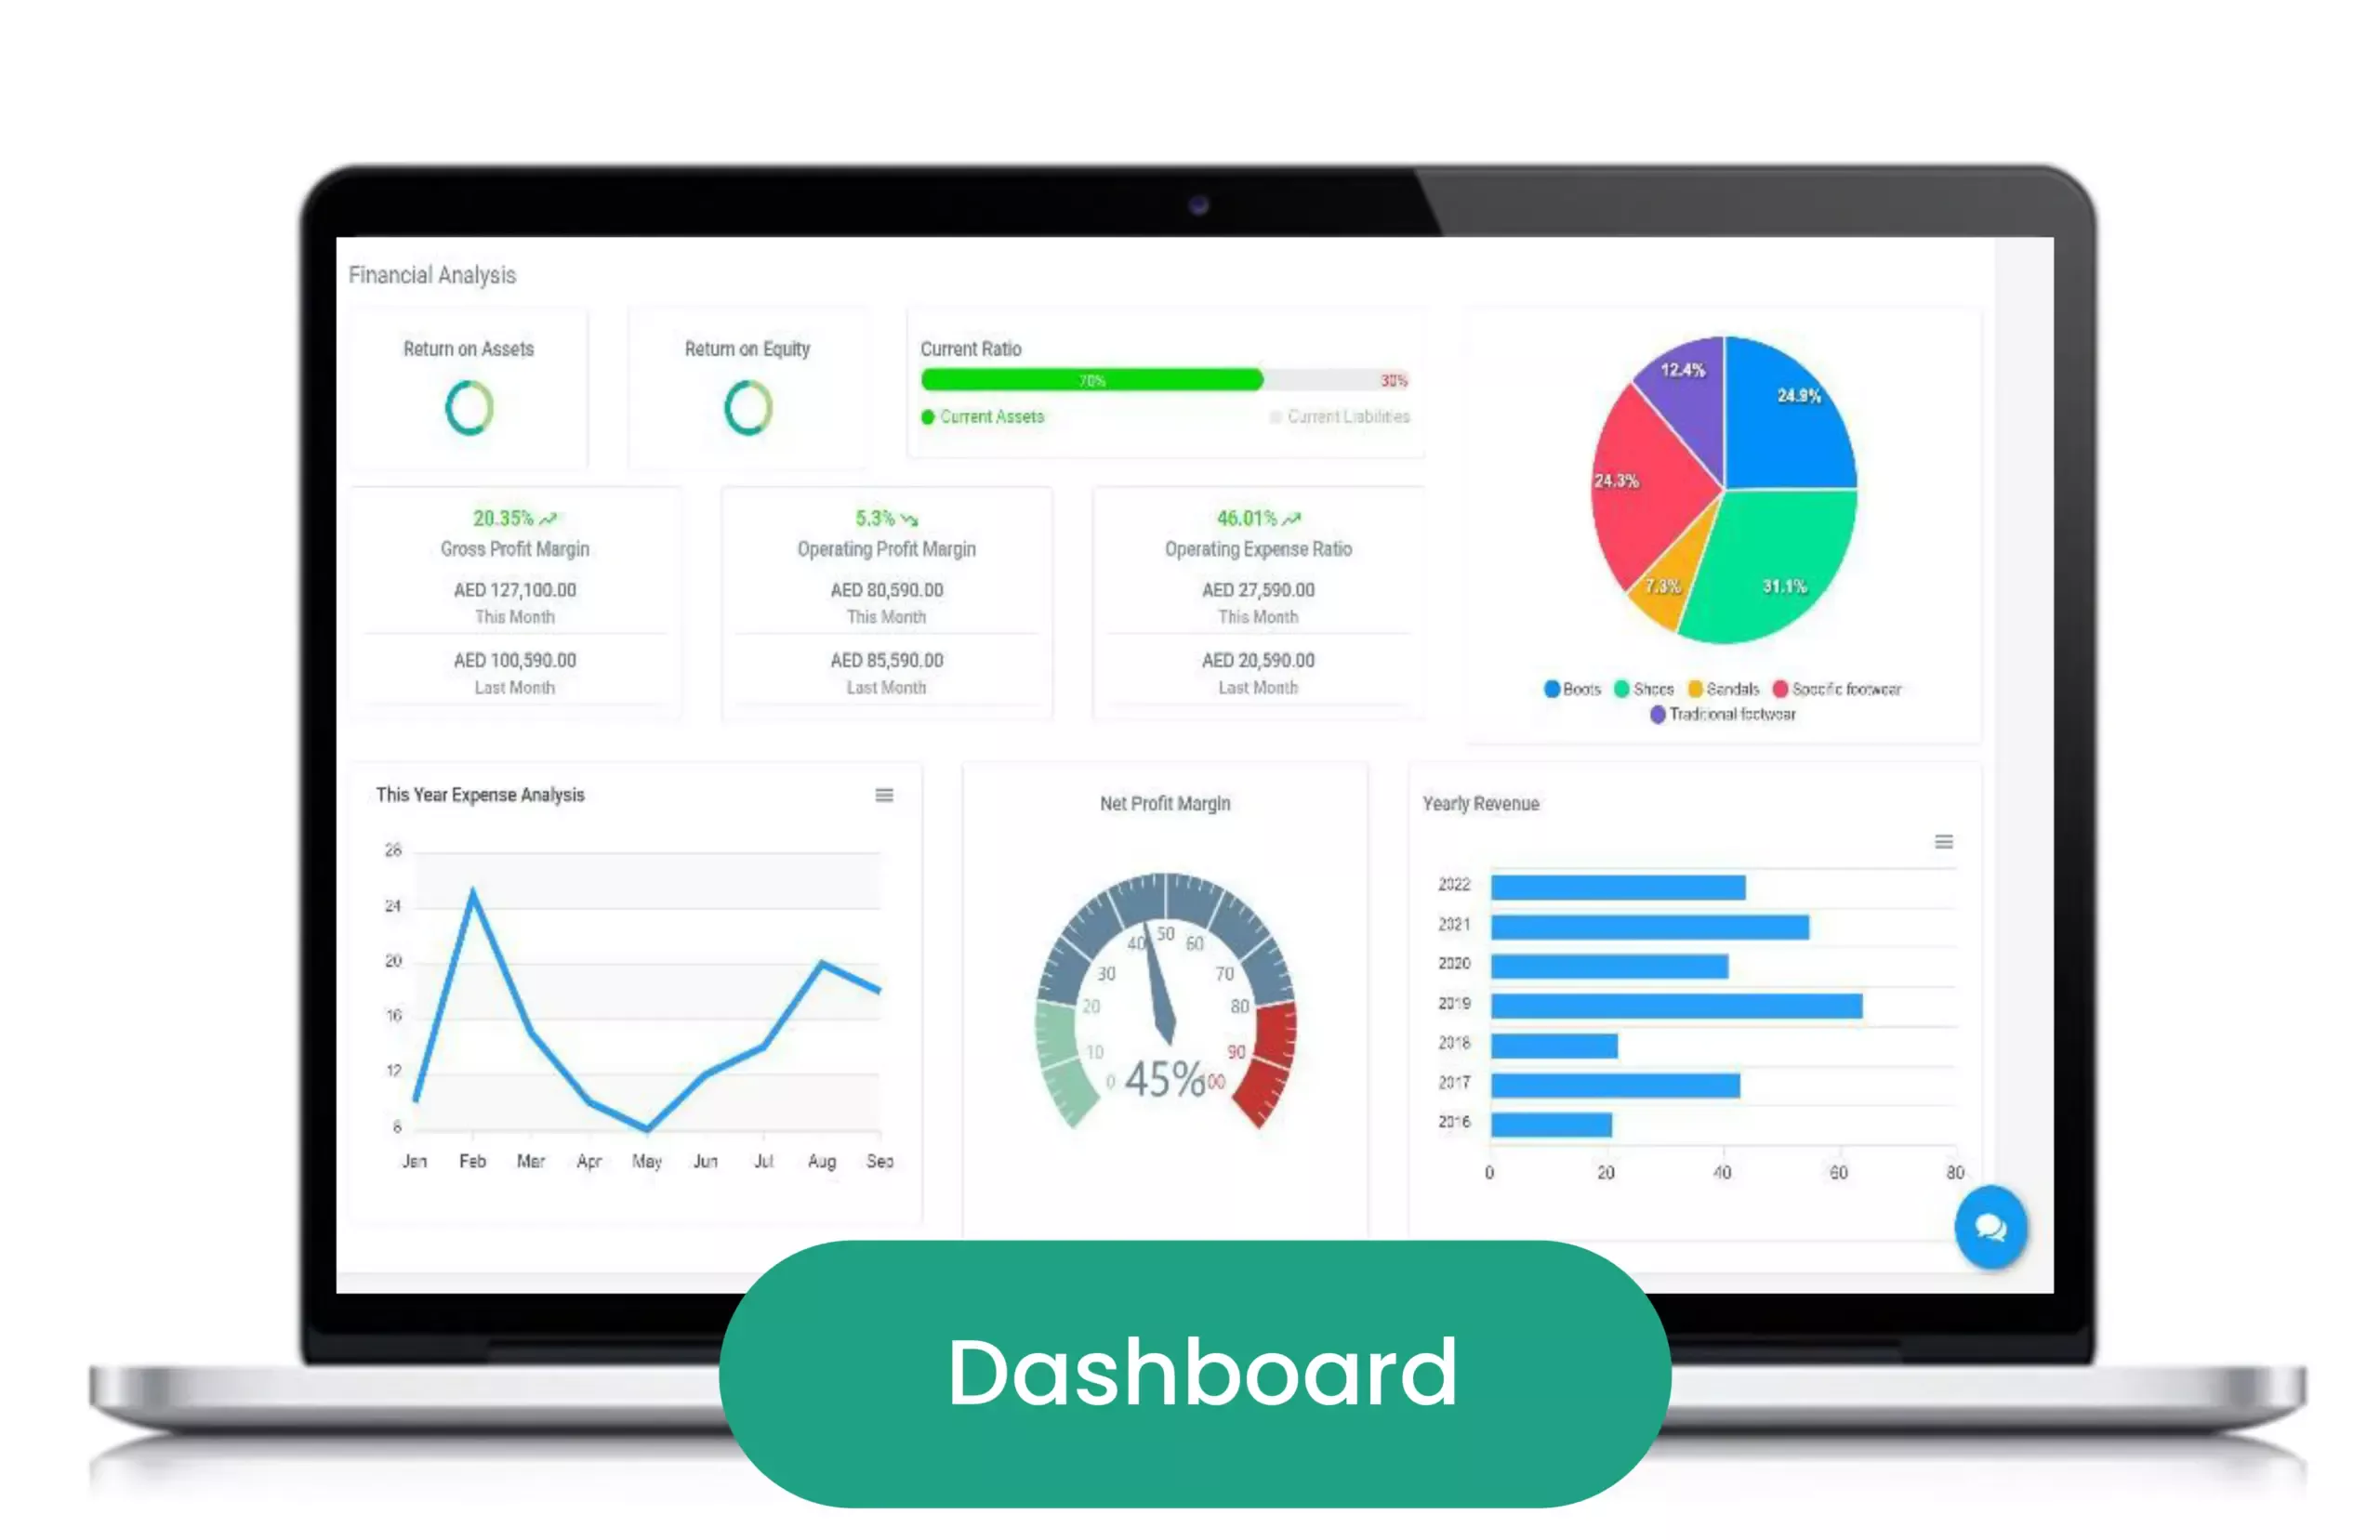
Interactive KPI dashboard for individual users to enhance the user experience.
A graphical representation of all sales data for each person. Real estate sales performance and conversion rates are improved with immediate visibility into the sales pipeline. View a summary of all enquiry jobs, the graphical sales chart, the number of completed bookings, the status of unit bookings, and the status of sales milestones.
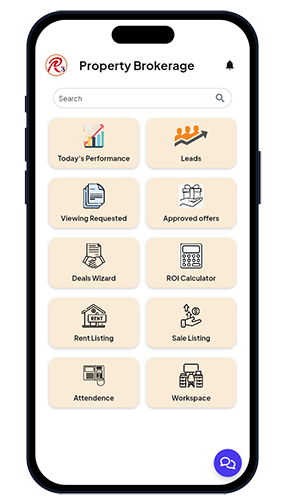
Mobile R3 AI Workspace
AI Algorithm
Mobile application with system audit notifications based on AI Algorithm.
Your team’s best performers in terms of sources of leads are revealed through marketing analytics, and sales activity is measured against the cost average. You may quickly integrate data and organize your revenue-generating activities with the help of marketing analytics.
PROPERTY BROKERAGE ERP
2XProductivity
A total solution for your company's stakeholders across the board. Use your time to produce value instead of paperwork by automating critical business operations.
Better Communication
Streamline your interactions with customers, vendors, and landlords. Utilise customised notifications, payment reminders, and maintenance tracking to stay in touch.
Grow Your Business
Making RealSoft R3 a business development tool can help you draw in new tenants and expand your portfolio.
Keep Your Edge
Real-time visibility into performance and customer satisfaction allows you to make quicker decisions and enhance KPIs.
Modules
- Property Brokerage Sales CRM
- Mobile App for Agents Management
- Property Viewing Request
- Offers to Customer with Picture
- Off Plan Projects
- Deal Wizard
- Lease Agreement
- Agent to Agent Agreement
- HR & Payroll and Staff Management
- Agency Agreement/Letter of Indent
- ROI Calculator
- Integrated VAT, Accounts/Finance Module
- AI enabled Workspace & Dashboard
RealSoft Interactive Dashboard
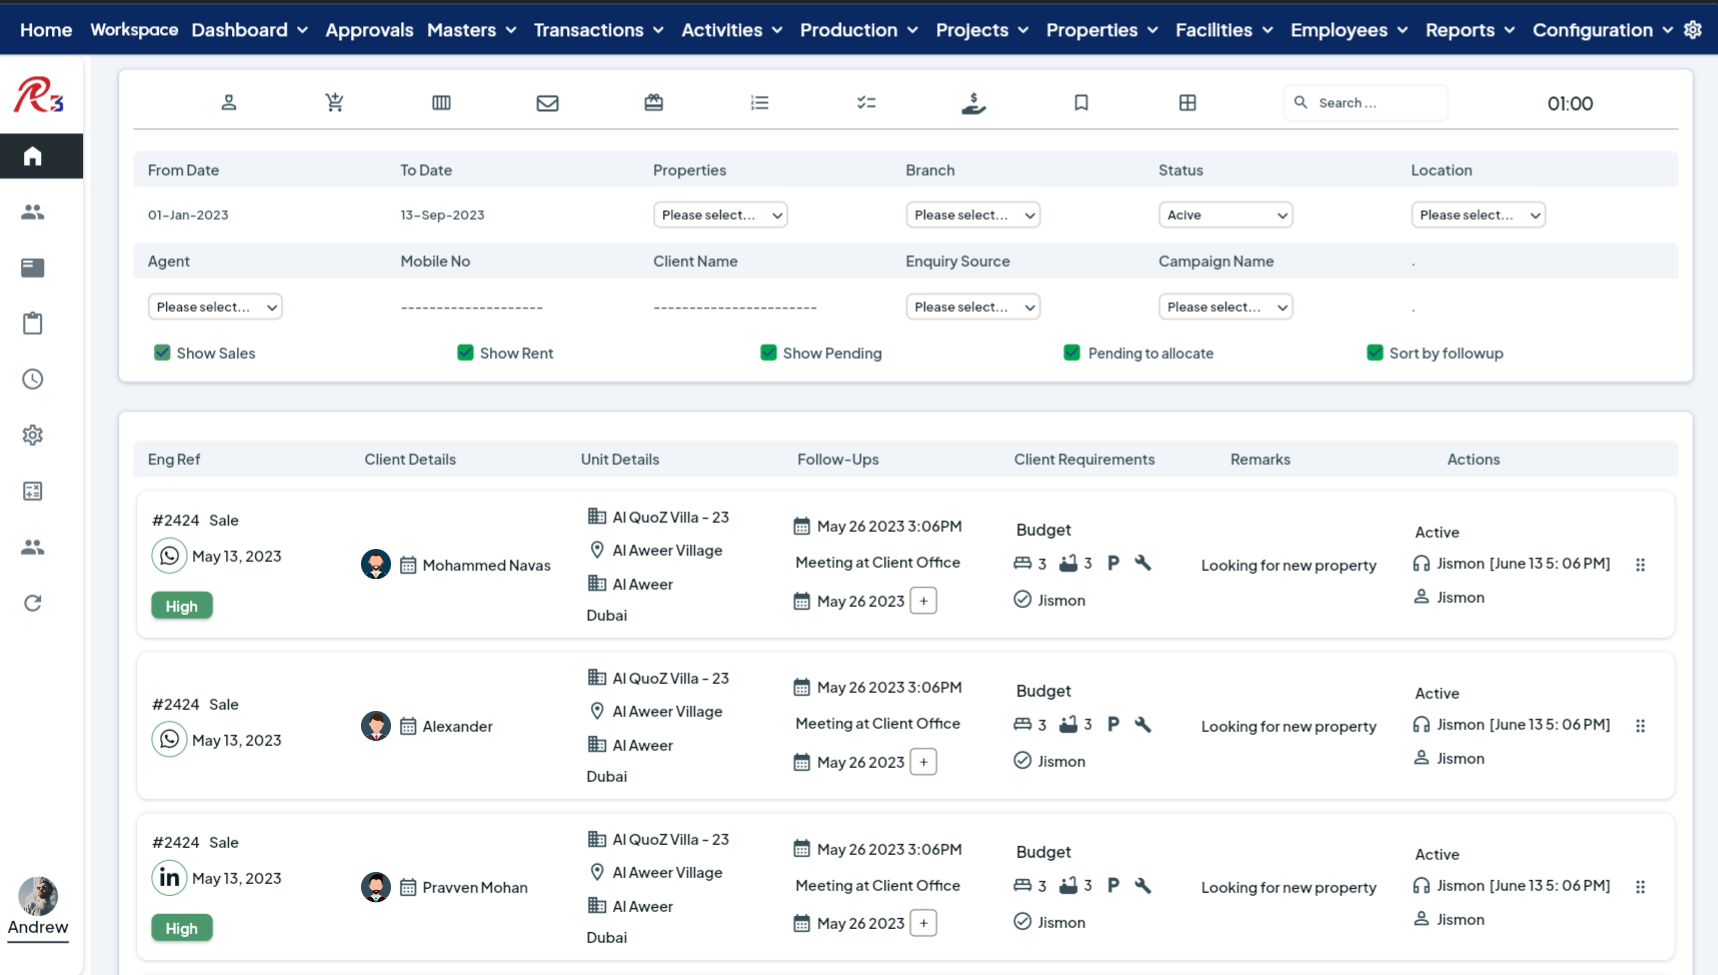
RealSoft interactive dashboard allows users to visualize and analyze data in a graphical format. It provides a summary or overview of key metrics and KPIs (key performance indicators) that are relevant to the user's business.
RealSoft Interactive Dashboard
RealSoft interactive dashboard allows users to visualize and analyze data in a graphical format. It provides a summary or overview of key metrics and KPIs (key performance indicators) that are relevant to the user's business.

Visualizations
RealSoft interactive dashboards include charts, graphs, and other visual elements to help users understand complex data sets more easily. These visualizations can be customized based on the user's requirements.
Real-time data
RealSoft dashboards can provide real-time data updates, enabling users to track metrics in real-time and make more informed decisions. This can be useful in areas where timely information is crucial.
Mobile accessibility
Our are designed to be mobile-friendly, allowing users to view and interact with the dashboard on their smartphones or tablets. The users can access and analyze data even when they are on the go.
Customization and personalization
Users can typically customize their dashboards based on their specific needs and preferences. This includes choosing the metrics and KPIs that are most relevant to them, arranging visualizations in a layout that makes sense to them.
Collaboration and sharing
RealSoft Dashboard can be shared with other team members, allowing for collaboration and discussion around the data. This can be done either by providing access to a live dashboard or by exporting or sharing static reports.
Data filtering and drill-down
Our dashboards often allow users to filter data based on specific criteria, such as time period, location, or product category. Users can also drill-down into specific data points or sections to gain more detailed insights.
Our Clients
List of popular clients we have






RealEstate Software Products and Platforms
Experience the Property Brokerage ERP Solution in UAE Today!.
4000+ successful ERP implementations.
We pledge to provide you with the very finest service at all times.
Contact us today and get a quote


